
164 electric models now available for sale in U.S.
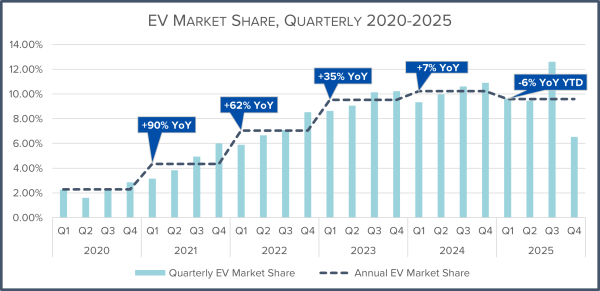
EVs: 6.5 percent of new U.S. light-duty vehicle sales in Q4 2025; 9.6 percent for full-year 2025
EVs now 2.5 percent of total light-duty vehicles in operation
Internal combustion engine vehicle market share down 24 percentage points since 2016
Charging infrastructure lags: Only 1 new public charging port added per 29 new registered EVs
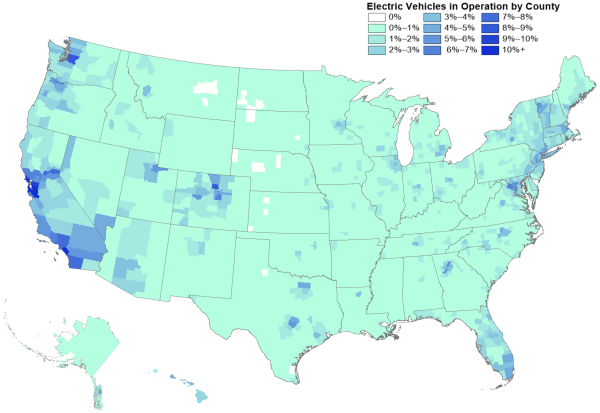
Spotlight: Geographic distribution of EVs and charging infrastructure remains uneven; half of all registered EVs located in just 42 counties
WASHINGTON, D.C. — Alliance for Automotive Innovation today released its exclusive state-by-state analysis of the U.S. electric vehicle market for Q4 and full-year 2025.
The Get Connected Electric Vehicle Report Q4 2025 summarizes EV sales and purchasing trends across all 50 states. The report features a breakdown of light-duty market share by powertrain (2016-2025) and a geographic distribution analysis of registered EVs and charging infrastructure.
EV sales in Q4 lowest since first quarter of 2022; down year-over-year
- EVs represented 6.5 percent of new U.S. light-duty vehicle sales in Q4 2025, down from 12.6 percent in Q3 2025 and a decrease of about 257,000 units.
- EVs represented 9.6 percent of new light-duty vehicle sales in 2025, down from 10.2 percent in 2024.
- 164 electric car, utility vehicle, pickup truck and van models now available for sale in the U.S. as of Q4 2025.
-
-
- Light truck sales represented 82 percent of the EV market, down 3 percentage points from Q3 2025.
-
-
- California (17 percent) led the country in EV registrations in Q4 2025, though down 14.6 percentage points from the previous quarter. EV market share decreased in every state and Washington, D.C., from the third quarter to the fourth quarter of 2025.
- Four states and the District of Columbia had EV registrations above 10 percent in Q4 2025:
-
-
- District of Columbia (16.3 percent); Washington (14.8 percent); Nevada (12.3 percent) Oregon (11 percent); and Hawaii (10.1 percent).
-
-
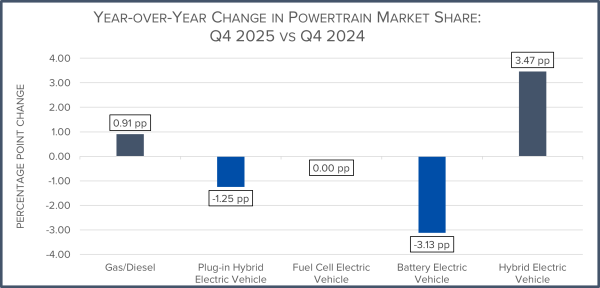
- Comparing Q4 2025 to Q4 2024, there were 187,000 fewer new EVs registered in the U.S. – a 43 percent volume decrease.
-
-
- Year-over-year, total light-duty vehicle sales (all powertrains) decreased 5 percent (about 198,000 fewer vehicles).
- EV market share decreased 4.4 percentage points.
- Hybrid market share grew 3.5 percentage points.
- Internal combustion engine vehicle market share increased by 0.9 percentage points, reversing the trend of quarterly ICE contraction.
-
-
- For full-year 2025, there were 1,511,549 EVs registered in the U.S. – a 4 percent volume decrease (about 63,500 fewer vehicles) compared to 2024.
-
-
- 2025 total light-duty vehicle sales (all powertrains) increased 2.2 percent (about 340,000 additional vehicles).
- EV market share decreased 0.6 percentage points.
- Hybrid market share grew 3.7 percentage points.
- Internal combustion engine vehicle market share decreased 3.1 percentage points.
-
-
 Public EV charging still lags in fourth quarter
- In Q4 2025, the number of publicly available EV chargers increased 22 percent from Q4 2024, while total EVs on the road increased 25 percent.
- Nationwide, there were 246,755 EVs registered in Q4 2025, but only 8,537 new public chargers added – a ratio of 29 new EVs for every new public port.
- There are 7.3 million EVs on the road (2.5 percent of vehicles in operation – a new high) and a total of 236,945 publicly available charging outlets in the U.S. – a ratio of 31 EVs for every public port.
- Composition of new public charging networks is shifting: Non-Tesla fast chargers outnumber new Tesla installations. Tesla dropped from 55 percent of all new fast charging installations in 2023 to 39 percent in 2025.
Spotlight: Uneven geographic distribution of EVs and charging infrastructure in U.S.
Among the 3,100 counties in the U.S.:
- Half of all registered EVs were located in just 42 counties (1.4 percent of all counties).
- 25 counties have no registered EVs.
- 646 counties (21 percent) have an EV in operation (E-VIO) rate greater than 1 percent.
- 274 counties (13 percent) have an E-VIO rate greater than 2 percent.
Read the full Q4 2025 Get Connected Electric Vehicle Report HERE.
Sign up to receive Get Connected EV reports HERE.
About Alliance for Automotive Innovation
From the manufacturers producing most vehicles sold in the U.S. to autonomous vehicle innovators to equipment suppliers, battery producers and semiconductor makers – Alliance for Automotive Innovation represents the full auto industry, a sector supporting 11 million American jobs and more than 5 percent of the economy. Active in Washington, D.C., and all 50 states, the association is committed to a cleaner, safer and smarter personal transportation future. www.autosinnovate.org