
Alliance for Automotive Innovation today released its exclusive state-by-state analysis of the U.S. electric vehicle (EV) market for Q4 and full year 2023.
The Get Connected Electric Vehicle Report summarizes EV sales and purchasing trends across all 50 states.
More EV models in market; sales up sequentially and year-over-year
- 114 EV cars, utility vehicles, pickup trucks and van models now available for sale in the U.S. in Q4 2023. Light truck sales represent 78 percent of EV market;
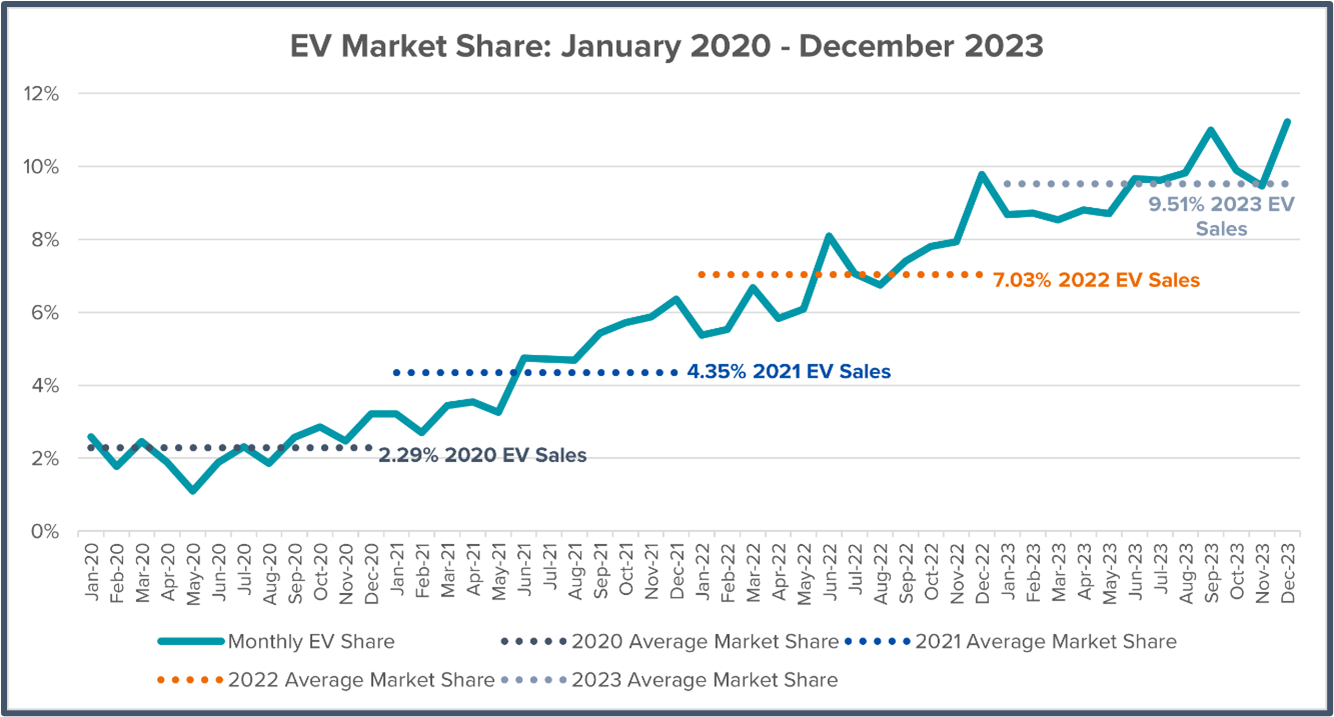
- EVs represent 10.2 percent of new light-duty vehicle sales in Q4 2023, up from 10.1 percent in Q3 2023 and 8.5 percent in Q4 2022;
- EVs represent 9.5 percent of new light-duty vehicle sales in 2023, up from 7 percent in 2022 and 4.3 percent in 2021;
- More than 377,000 EVs sold in U.S. in Q4 2023, a 34 percent increase over Q4 2022;
- Top five list for EV sales through 2023: California (25.7 percent); District of Columbia (19.6 percent); Washington (18.8 percent); Oregon (15.4 percent) and Colorado (15.1 percent).
Public EV charging still lags
- Installation of U.S. public chargers is not keeping up with current and projected EV sales;
- In 2023, the number of publicly available EV chargers increased 27 percent year-over-year – while EV sales increased 51 percent;
- Nationwide, 377,383 EVs were registered in Q4 2023 but only 8,869 new public chargers added – a ratio of 43 EVs for every new public port;
- There are 4.3 million EVs on the road (1.5 percent of all light-duty vehicles in operation) and a total of 159,842 publicly available charging outlets in the U.S. – a ratio of 27 EVs for every public port;
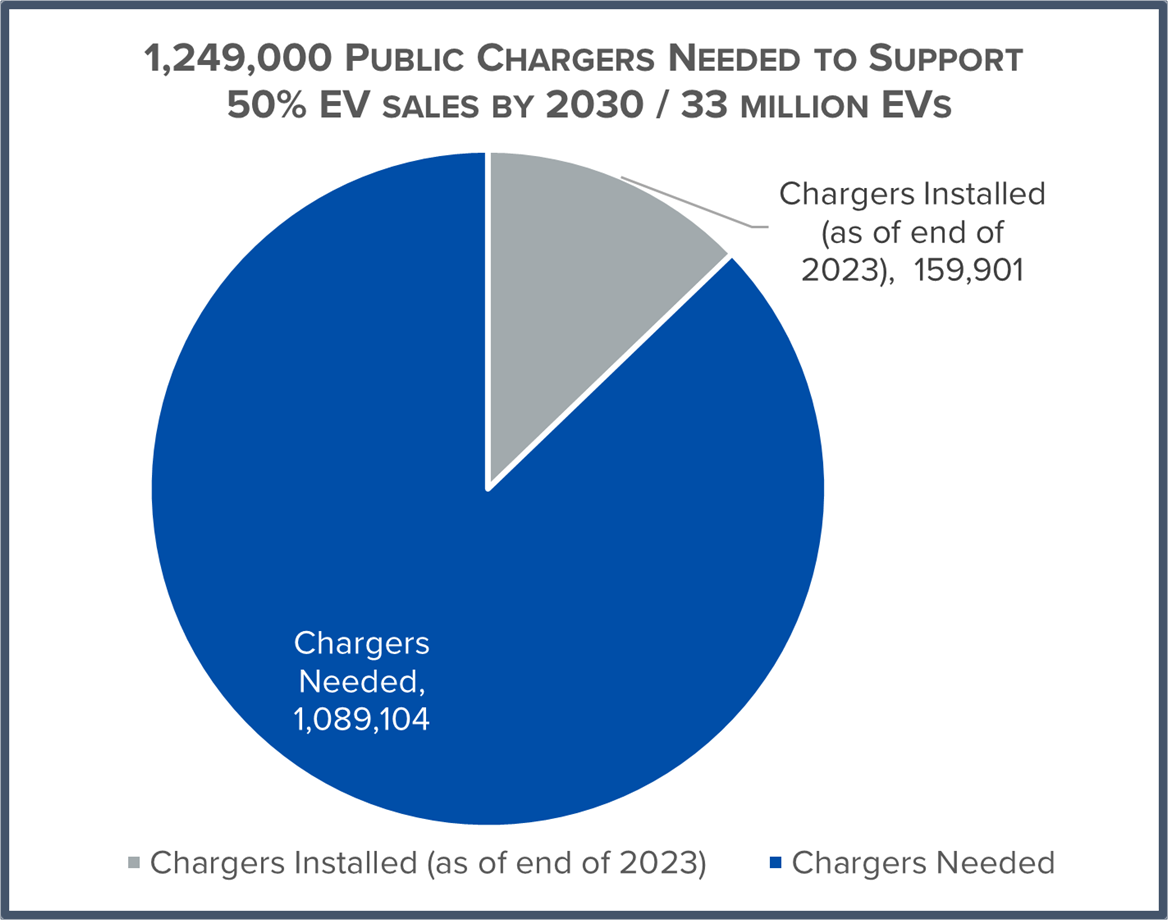
- 1.2 million public chargers (1,067,000 Level 2 and 182,000 DC Fast) are required to meet the National Renewable Energy Laboratory’s necessary infrastructure estimate for 2030;
- Nearly 1.1 million more public chargers (945,000 Level 2 and 144,000 DC Fast) need to be installed;
- Put another way, 437 chargers will need to be installed every day, for the next 7 years – or nearly 3 chargers every 10 minutes – through the end of 2030;
- (Level 2 ports can charge battery electric vehicles in 4-10 hours. DC Fast ports can charge battery electric vehicles in 20 minutes to one hour.)
Uneven geographic distribution of EVs and charging infrastructure in U.S.
Of the more than 3,100 counties in the U.S.:
- 31 percent (983 counties) had zero public charging ports at the end of 2023 – compared to 39 percent in 2022;
- 90 counties installed their first public charger in 2023;
- The top 25 counties with the most public charging ports accounted for one-third of all available U.S. public chargers.
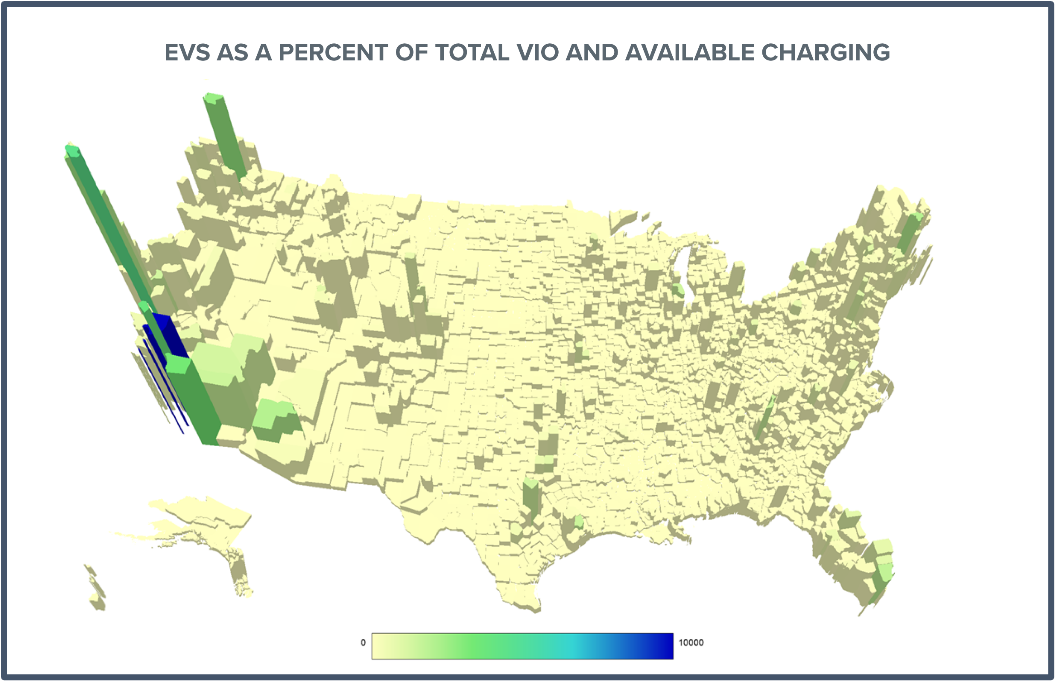
Height represents percent of EV VIO and color represents public charging
In 2023, there were 33,023 new public EV chargers (22,591 Level 2 and 10,432 DC Fast) added:
- 12 percent of U.S. counties added ZERO new charging ports;
- 40 percent of U.S. counties added 10 or fewer charging ports;
- 33 percent of new charging ports were located in just 1 percent of U.S. counties;
- 20 percent of all new charging ports were in California.
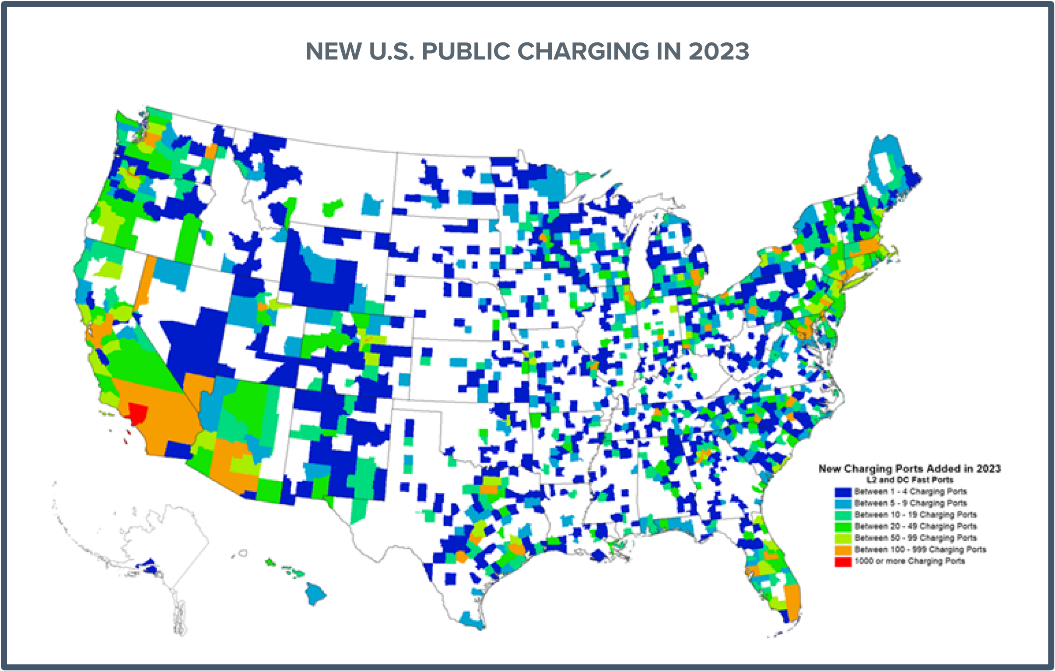
White areas had no public EV chargers added in 2023; blue areas had less than 10 added in 2023
Automakers and battery partners have committed $125 billion (so far) to expand the production of EVs and batteries inside the U.S. and across North America. A successful transition to electrification – and meeting government requirements – will depend on factors outside the vehicle.
Read the Q4/full year 2023 Get Connected Electric Vehicle Report.